![Kara Connect - Logo A - RGB - White.png]](https://support.karaconnect.com/hs-fs/hubfs/Kara%20Connect%20-%20Logo%20A%20-%20RGB%20-%20White.png?height=40&name=Kara%20Connect%20-%20Logo%20A%20-%20RGB%20-%20White.png)
What it is
The Wellbeing report in the manager app has a new section called “Support impact on employees’ wellbeing”. It replaces the old WHO-5 Wellbeing Index card for every hub. The old card answered “how are our people doing?” The new one answers “is the support working?” It does that by showing how employees’ WHO-5 scores have moved over time.
Where to find it
Manager app → Reports → Wellbeing.
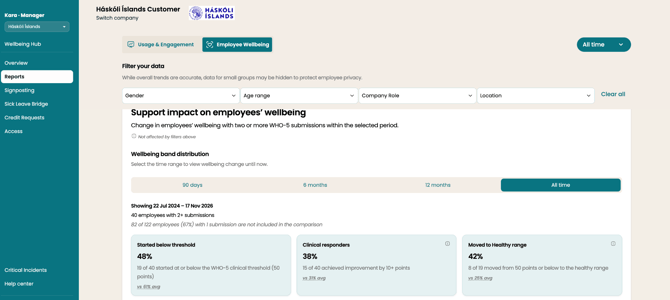
Who’s counted
- Only employees with two or more WHO-5 check-ins in the chosen period. You can’t measure change from one score.
- A note shows how many people had only one check-in and so aren’t counted, e.g. “15 of 100 employees (15%)“.
- The section has its own time range: 90 days, 6 months, 12 months or All time. The page filters above it don’t change it, and the exact dates are shown on the section.
- Scores are reported by employees themselves. The section is labelled “Employee-reported”.
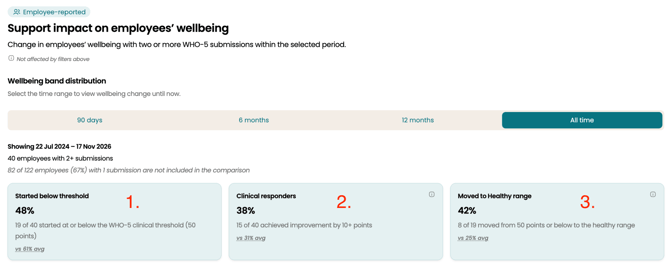
The three headline numbers
- Started below threshold. How many people scored 50 or below (out of 100) on their first check-in, i.e. who came to Kara struggling.
- Clinical responders. How many improved by 10 points or more. Research treats 10 points as clinically meaningful change (Guico-Pabia et al., 2012; Norman et al., 2003).
- Moved to Healthy range. Of those who started at 50 or below, how many are now above 50.
Each number has a small “vs X% avg” next to it. That’s the average across all Kara hubs, so managers can see how they compare.
The flow chart
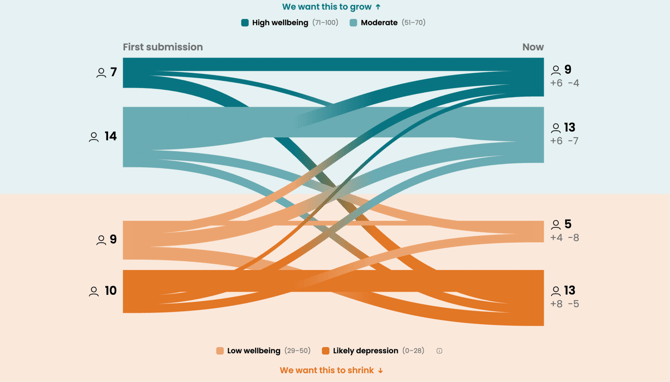
This chart shows people moving between four wellbeing bands, from their first check-in to their latest:
- High wellbeing (71–100)
- Moderate (51–70)
- Low wellbeing (29–50)
- Likely depression (0–28)
The top two bands are marked “we want this to grow” and the bottom two “we want this to shrink”. That’s the quickest way to read it.
How to interpret it
- Look at direction, not the exact figures. The question is whether people are moving up the bands.
- Scores can dip before they improve. That often means someone is being more honest about what’s going on. A dip in one period isn’t a sign the support isn’t working.
- Small hubs mean small numbers. If only a handful of people have two check-ins, one person changes the picture a lot. Look at trends over 6–12 months.
- It’s aggregate only. “Likely depression” is a count, not a diagnosis, and it never names anyone. Managers should not approach individual employees based on it. If the number is high or rising, they should talk to their Kara Customer Success contact.
- More check-ins give a fuller picture. The section grows as more employees complete a second WHO-5. Encouraging employees to complete their check-ins helps.
Why it matters
It gives HR a defensible line for budget conversations. “X of Y employees improved by a clinically meaningful amount” is much stronger than “our average score is 58”.