![Kara Connect - Logo A - RGB - White.png]](https://support.karaconnect.com/hs-fs/hubfs/Kara%20Connect%20-%20Logo%20A%20-%20RGB%20-%20White.png?height=40&name=Kara%20Connect%20-%20Logo%20A%20-%20RGB%20-%20White.png)
All data is aggregate and anonymous. You never see which individual employees are booking or what they discuss in sessions.
Treatment Focus
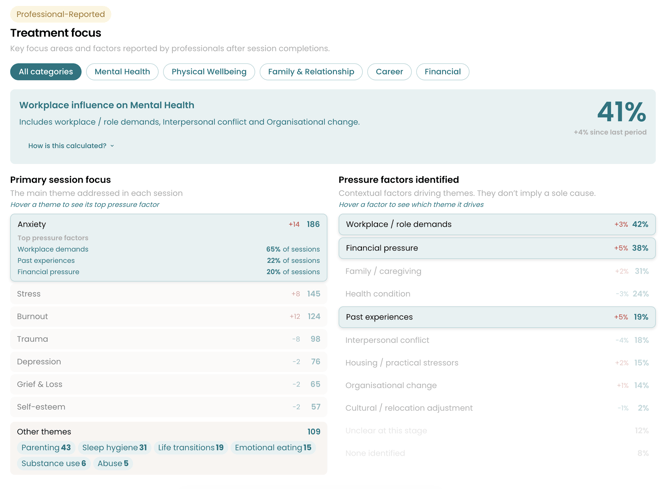
Treatment Focus report showing primary session themes and pressure factors
The Treatment Focus section is split into two side-by-side views.
Primary Session Focus (left side)
This shows the main themes that practitioners are addressing in sessions, ranked by frequency. Common themes include:
- Workplace Stress
- Low Mood
- Relationship Conflict
- Sleep Hygiene
- Anxiety
Each theme shows: - Session count — how many sessions focused on this theme in the selected period - Change indicator — whether this theme is increasing (+) or decreasing (-) compared to the previous period. A rising number in a theme like “Workplace Stress” tells you that more employees are presenting with work-related issues.
How it’s calculated: After each session, the practitioner records the primary focus theme. This is a clinical judgement by the practitioner, not a self-report from the employee. One session = one primary theme.
Pressure Factors (right side)
This shows the contextual factors that practitioners identify as driving the session themes. These are the underlying causes behind the presenting issues:
- Workplace / role demands
- Interpersonal conflict
- Past experiences
- Financial pressure
- Family / caregiving
- Organisational change
- Health condition
- Housing / practical stressors
- Cultural / relocation adjustment
Each factor shows a percentage — the proportion of all sessions where this factor was identified. A single session can have multiple factors.
Two special entries appear at the bottom: - Unclear at this stage — the practitioner hasn’t yet identified the driving factor (common in early sessions) - None identified — no specific pressure factor was relevant
How it’s calculated: Practitioners can record one or more pressure factors per session. The percentage shows how many sessions (out of all completed sessions in the period) included that factor. Because sessions can have multiple factors, percentages can add up to more than 100%.
Interactive exploration
The two columns are linked. When you hover over or select a theme on the left (e.g., “Anxiety”), the right side highlights the top pressure factors associated with that theme. For example, hovering over Anxiety might reveal:
- Workplace demands 38% of sessions
- Past experiences 28% of sessions
- Health condition 22% of sessions
This tells you that anxiety presentations in your workforce are primarily driven by workplace demands — a potentially actionable insight. Please note that the pressure factors that are shown on the left side only include the top three factors. There could be more pressure factors that are not shown.
It works the other way too: hover over a factor on the right (e.g., “Workplace / role demands”) and the left side highlights which themes it drives.
Workplace Influence Rate
At the top of the Treatment Focus section, you’ll see a Workplace Influence banner showing a single percentage. This is one of the most important numbers in the report.
What it means: The percentage of completed sessions where the practitioner identified at least one workplace-linked pressure factor (role demands, interpersonal conflict, or organisational change).
Example: If the workplace influence rate is 42%, it means that in 42% of all wellbeing sessions during this period, the practitioner identified a connection to the workplace.
How it’s calculated: We count the distinct completed sessions where the practitioner recorded at least one of the three workplace-linked factors, then divide by the total number of completed sessions in the period.
Why it matters: This number tells you whether your wellbeing hub is addressing workplace-related issues or primarily personal ones. A high workplace influence rate (above 40%) suggests that work conditions are a significant driver of employee wellbeing needs — which may warrant looking at team structure, workload, or management practices alongside the therapeutic support.
You can filter by practitioner category (e.g., Mental Health, Physical, Career) to see whether workplace influence is higher for certain types of sessions.
Factor-to-Focus Cross-Tabulation
.png?width=670&height=548&name=image%20(68).png)
Factor-to-focus cross-tabulation and pattern signals
The Factor-to-Focus section gives you the complete picture of how every pressure factor relates to every session theme. While the Treatment Focus view above shows linked factors one theme at a time, this cross-tabulation shows all relationships at once in a matrix.
How to read it
The matrix is a table where: - Rows are pressure factors (e.g., Workplace / role demands, Interpersonal conflict, Organisational change) - Columns are session themes (e.g., Workplace Stress, Anxiety, Low Mood, Relationship Conflict) - Each cell shows the percentage of sessions with that theme where the practitioner also identified that factor
For example, if the cell at “Organisational change” row and “Workplace Stress” column shows 22%, it means that in 22% of sessions where Workplace Stress was the primary theme, the practitioner also identified organisational change as a contributing factor.
Change indicators in cells
Each cell can also show a small change indicator (+/-) comparing to the previous period. This helps you spot shifts — for example, if “Organisational change” driving “Anxiety” has jumped from 5% to 12%, that’s a signal worth investigating.
How it’s calculated: For each theme-factor combination, we count sessions where both the theme and the factor were recorded, then divide by the total sessions with that theme. This gives you a percentage that answers: “Of all Anxiety sessions, what proportion involved organisational change?”
When to use this view
The cross-tabulation is best used for quarterly analysis where you have enough data to make the percentages meaningful. Use it when you want to:
- See the full landscape of what’s driving sessions — not just the top factors per theme
- Spot unexpected connections (e.g., financial pressure appearing in 15% of mental health sessions)
- Prepare for a wellbeing review or board report — this view gives you the data to back up specific claims about what’s happening in your workforce
You can click any cell to filter the rest of the report by that specific team and location combination.
How to Identify Trends
-
Use the time range selector
Switch between monthly, quarterly, yearly, and all-time views to spot patterns at different scales: - Monthly — good for spotting sudden spikes (e.g., stress increases after a restructuring announcement) - Quarterly — shows seasonal patterns and is the best view for the factor-to-focus cross-tabulation - Yearly — shows whether your overall wellbeing picture is improving or declining.
-
Watch the change indicators
Every theme and factor shows a change indicator (+/-) compared to the previous period. Pay attention to: - Rising workplace stress or role demands — could signal a systemic issue, not just individual cases - Rising “unclear at this stage” — could mean employees are presenting earlier (positive) or that practitioner recording needs attention - Declining themes — good news, but verify it’s a real trend over 2-3 periods, not a single-month blip
Important: Rising treatment counts are shown in a warning colour because they indicate more employees presenting with that issue. Declining counts are shown in teal because they suggest improvement. This is the opposite of what you might expect from a typical business metric where “up is good.”
-
Use the interactive hover to find root causes
The interactive hover on Treatment Focus is your most powerful analytical tool. When a single factor (like “organisational change”) is linked to multiple themes (stress, anxiety, sleep issues), that factor is likely a root cause worth addressing at the organisational level — not just something for individual therapy sessions.
-
Track the Workplace Influence Rate over time
Compare the workplace influence percentage quarter-over-quarter. If it’s rising, work conditions are becoming a bigger driver of sessions. If it’s falling, either conditions are improving or employees are presenting with more personal issues — both are useful signals for planning your wellbeing strategy.
-
Use demographic filters for targeted insights
If you have the demographic filters enabled (Job Role and Location), you can slice the Treatment Focus and Factor-to-Focus data to compare: - Is workplace stress higher in specific teams or locations? - Are certain offices showing different pressure factor profiles? - Do different roles present with different themes?
This turns a broad picture into targeted, actionable insights that you can take to specific team leads or site managers.
Privacy
- All data in these reports is aggregate — you see trends across your workforce, never individual employee data
- The minimum cohort threshold (10 active users) is enforced — if a filter combination produces too few users, the data is suppressed entirely to protect privacy
- Treatment focus and pressure factors are recorded by practitioners based on their clinical judgement, not self-reported by employees
- Employees cannot be identified from any data point in these reports
- Session content is never visible — only the theme and factor classifications that practitioners record after each session